Let’s not beat around the bush, Google Analytics is one of the most powerful analytics tools available. We’re not the first people to say it, and we definitely won’t be the last. Regardless of our enthusiasm, how many business owners actually understand how to use it, let alone how to use it well?
In this blog post we’ll be covering 3 features you’re probably not using. These features will not double your profits or triple your conversions. However, they will give you the data to help towards improving your website and understanding your audience. So let’s get into it.
1. Understanding your popular pages
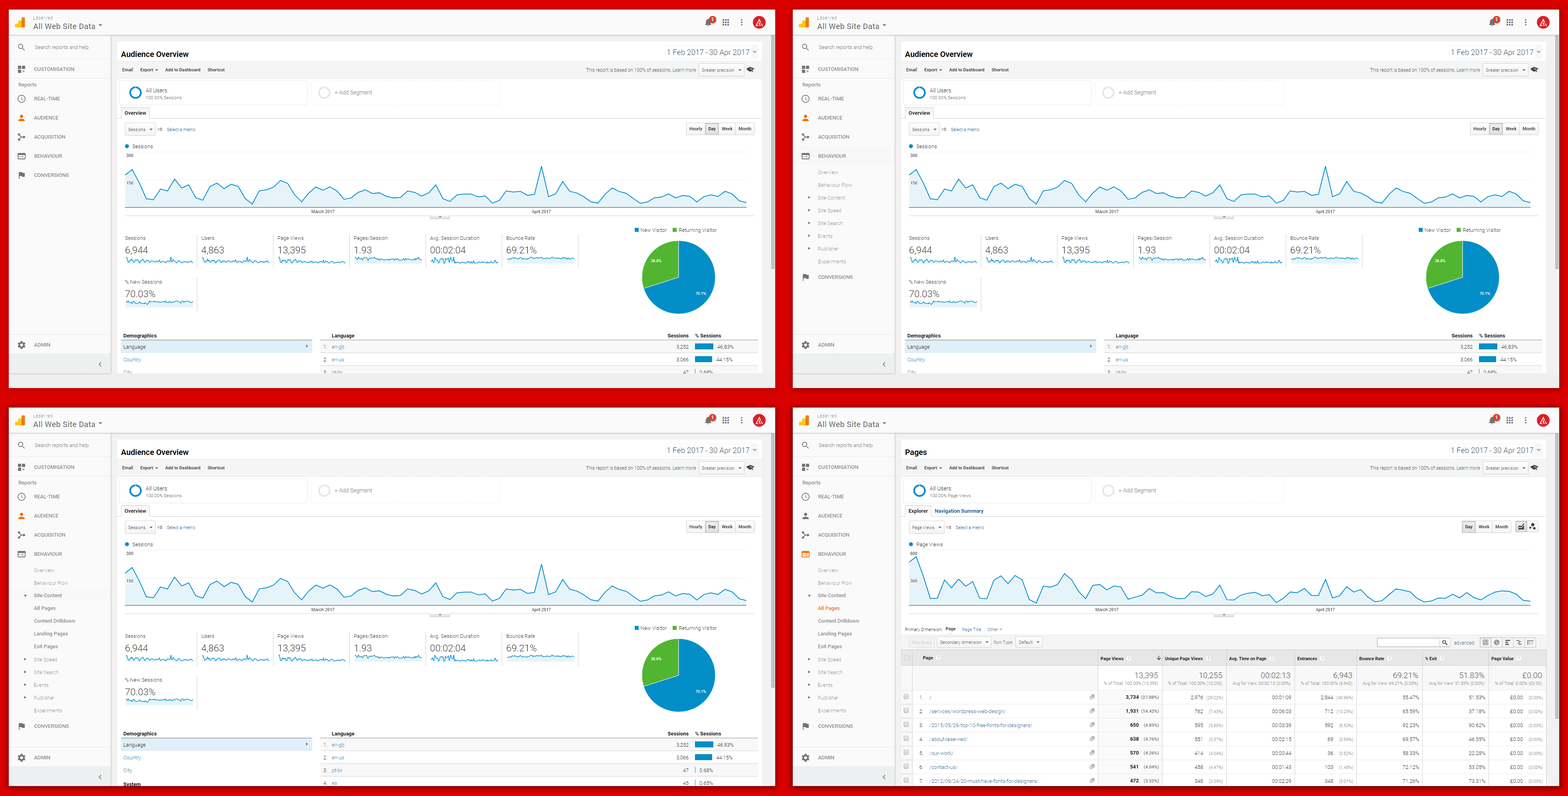
Once you have logged in, you should see the following screen. On the panel to the left, click on Behaviour > Site Content > All Pages and you will get a breakdown of your most popular pages. You should see something like this:

From here you can see the total amount of page views, the unique page views and average time spent on the page. This data gives you a good idea of how many individual people are looking at your pages.
In our eyes, the most important statistic here is Bounce Rate. Bounce rate is the percentage of people who visited the page but did not interact with it. If you’re a blogger, being able to see your most popular blogs is very important. It shows you the content your audience want to read. The average bounce rate can change per industry, which leads us perfectly into the next point…
2. Benchmarking
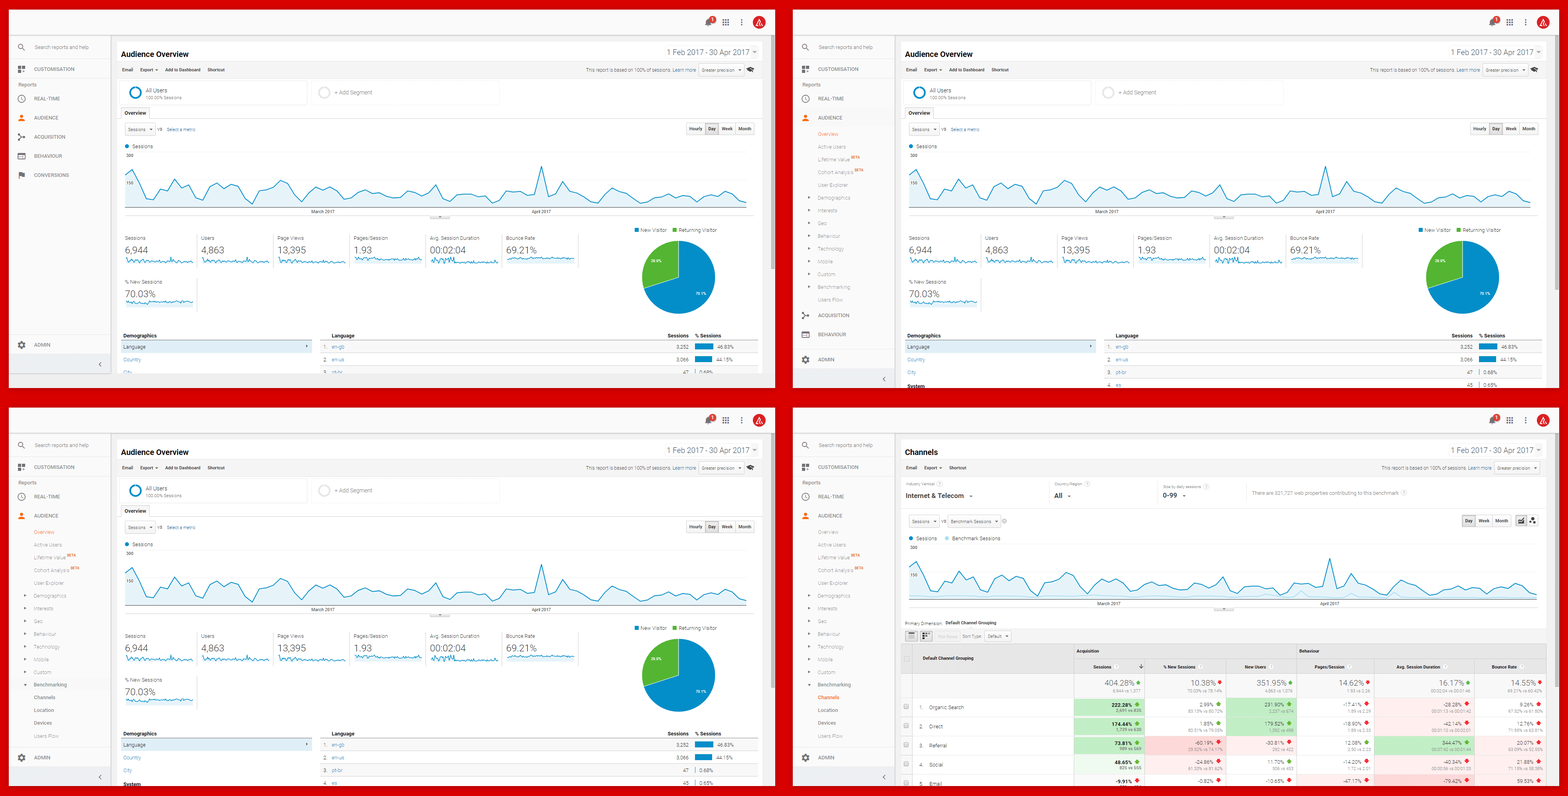
From the left-hand panel click on Audience > Benchmarking > Channels. Under the Channels heading, you’ll be able to select your industry. The table below will now give you a breakdown of each of your marketing channel’s performance, compared to your industry averages. Use this data to plan where you need to spend time developing or reassigning your marketing budget.

3. Goals and Conversions
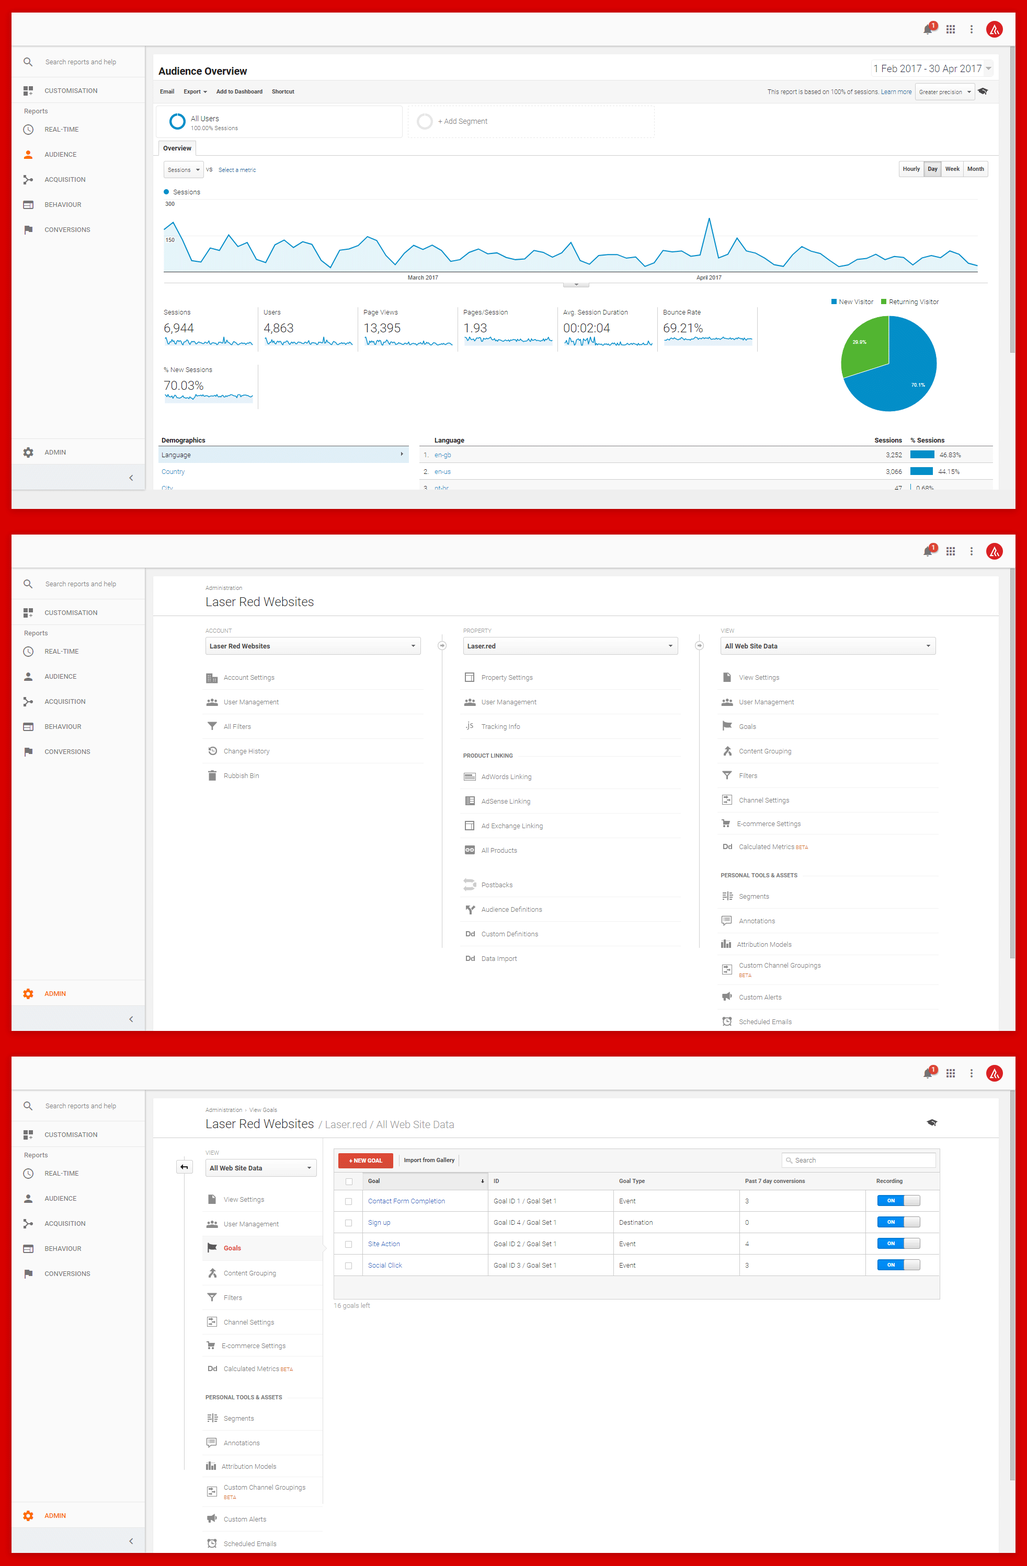
Conversions are not bound only to e-commerce websites. A conversion does not need to have a monetary figure for it to be important to your business. The most popular goal we use is the “Contact Form Completion” goal. Add goals by clicking the Admin (or cog) at the bottom of the left-hand panel. You can then click Goals under the right-hand View column. From here, the world is your oyster.

It’s important to be tracking goals specific to you and your business. It allows you to see whether your website is working for you, or against you. If you have Google Tag Manager installed and want to get REALLY fancy, you can link your goals with triggers within Google Tag Manager. That way you can track clicks of social media buttons or telephone number clicks.
Which specific goals to create for your business, and how to set these up, is an entire blog post on its own. Keep your eyes peeled for that in the coming weeks. We’ll be covering our 3 most popular goals for Google Analytics, and how you can use them to help grow your business.
Our Brucey Bonus
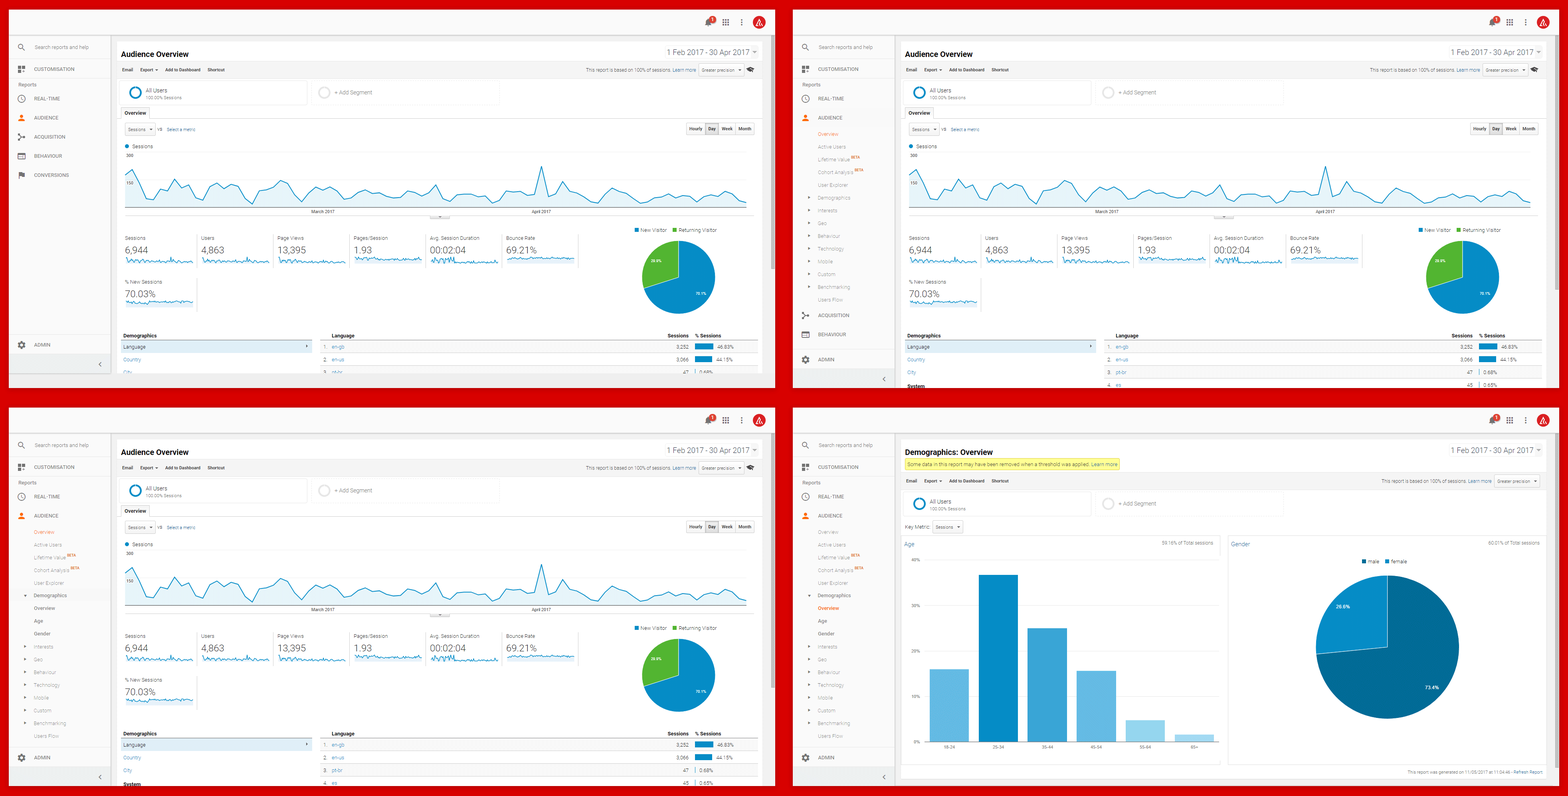
We’re feeling generous, so here is one last quick little tip for you. If you haven’t already done this, it takes two seconds and gives you incredible data. Log into your Google Analytics account, click Audience on the left-hand panel then click Demographics. It will ask if you want to start capturing this data, click Yes and you’re done.
Over the next week or so you’ll be able to see an insight into your Age and Gender Demographics (as long as you are receiving enough traffic to your site for this data to be captured). This is valuable data, which will allow you to target your content to your specific audience. Which is always handy!

Need some help?
If there’s anything here you’d like to know more about, feel free to send me an email on tom@laser.red or call on 01472 878496. I’d be more than happy to give you a hand 🙂